Mouse Tracings
The Mouse Tracings project is a data representation project involving measurements of window, keyboard and mouse activity on my desktop computer at home.
I wrote Python scripts to collect the data. For over a year, every time I turn on my computer the Python code would record the mouse position, right and left clicks, mouse wheel use, and key presses. It would also keep track of the active window, identifying the active application.
Using this data, I can create visual depictions of my interaction with my computer using Processing. Patterns emerge that are visually appealing and informative. This project inspired my interest in mastering keyboard shortcuts.
I got the idea for this project from Ali Eslami, a visual artist in Tehran, Iran. I discovered his tracing mouse movements project (no longer available online) while browsing Vimeo.
I once met the data artist Laurie Frick who said that she believed in the metaphysical idea that your data doesn't just represent you, it is you. This project is also inspired by her ideas.
You can see the collection in the gallery here.
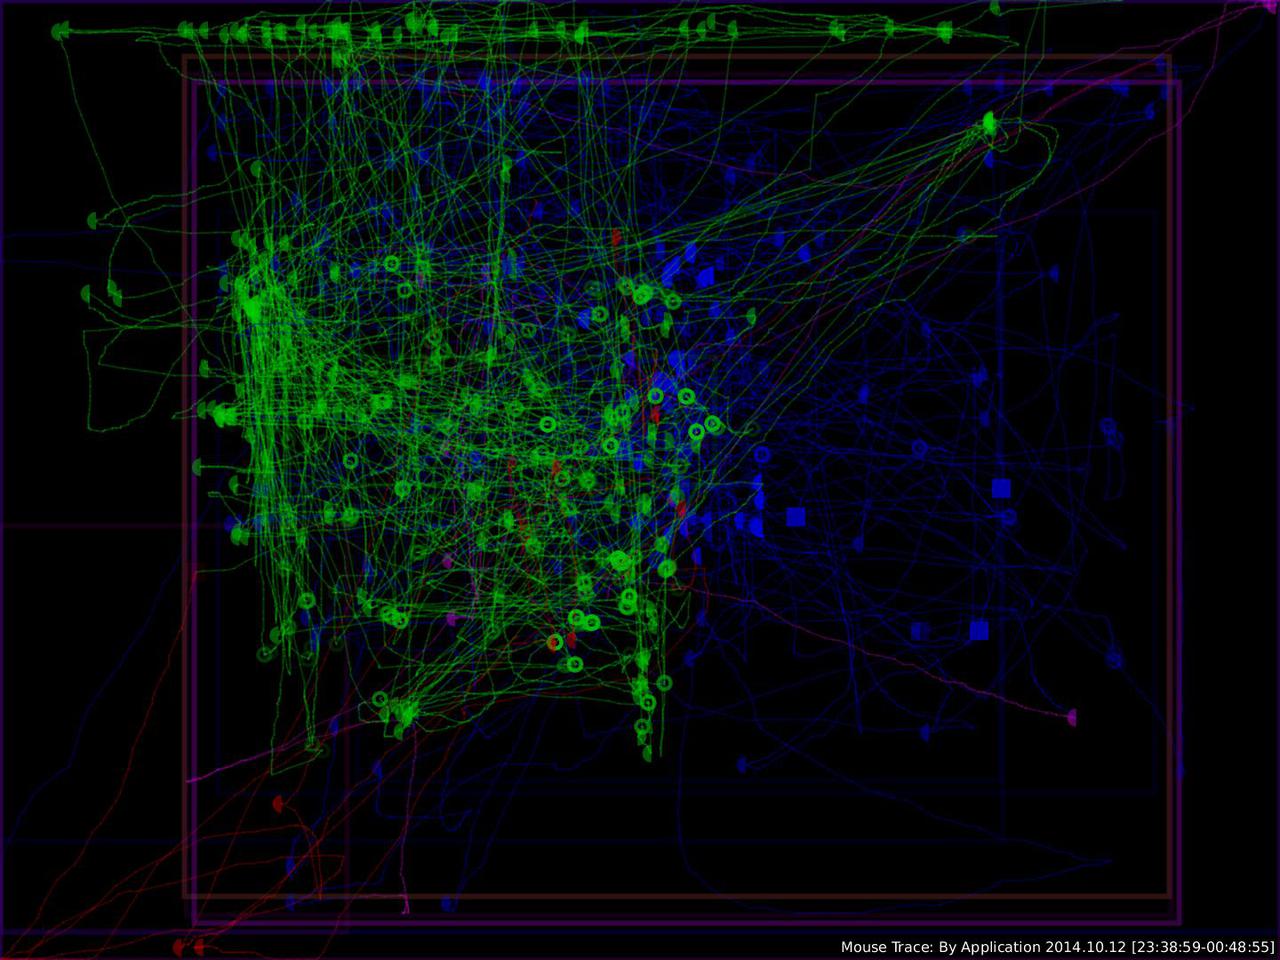
The mouse positions are represented as a continuous line. Right and left clicks are represented as right and left semi-circles. Use of the mouse wheel is represented as a ring. Keystrokes are represented as squares, drawn in the location of the mouse at the time of the keystrokes. The shapes are all drawn as partially transparent objects so multiple keystrokes or mouse clicks will appear as brighter colors.
The colors are selected in two ways. The first is by coloring everything based on the active application at the time the data was recorded. My Python script can identify the active application by querying the window manager and finding the title of the window that has focus. If no window has focus, then the window manager itself has focus, which in my case is KDE (a popular window manager for Linux). The table below lists the colors assigned to each application.
Application |
Color |
|---|---|
KDE (Window Manager) |
red |
Evernote |
yellow |
Eclipse |
green |
Dolphin (File Explorer) |
cyan |
Chromium |
blue |
Konsole (terminal) |
purple |
Unknown |
magenta |
In some cases I can see from the images that I am using my computer inefficiently. For example, in the past I would close windows by clicking on the 'x' in the upper right hand corner. Now I use the keyboard shortcut Alt-F4.
Alternatively, I also make some visualizations with random colors assigned to each kind of computer input. Look in the lower right hand corner of each to see if the colors are random or by application.
Finally, I set up my computer to draw these images in real time, and display the latest image as the background of my computer. Every 10 seconds the Processing sketch re-reads the data files and creates a visualization of my activity since the computer has been turned on. When I turn on my computer the background is blank. As I use it, the background evolves and explodes with color. Before I turn my computer off, I can see the artwork I have created, as a mere by-product of my interaction with my machine.
In the future I would like to expand this project to include animations, showing how the images grow over time. Also, the data can be represented in completely different ways. Since I have a long history of data, I can make heat maps of the probability distribution of the mouse position. Less artistic projects include scientific study of the efficiency of my computer interactions and quantitative measurements of input speeds with tests of alternate computer accessories, such as a gaming keyboard and mouse.